
Funding-market stress usually shows up in a handful of plain numbers well before it makes headlines. I wanted something that watches those numbers for me and only speaks up when it matters, so I built Liquidity Monitor: a long-running Python service that polls public data and pushes an alert when conditions deteriorate.
What it watches
Data comes from the free FRED API. The bot tracks:
- the SOFR vs IORB spread (a liquidity stress index in basis points),
- reverse repo (RRP) balances,
- yield curve inversion (2s10s),
- VIX, and
- USD strength (DXY, USDJPY).
A four-level state machine
Raw thresholds make for noisy alerts, so the bot keeps state and moves between four levels:
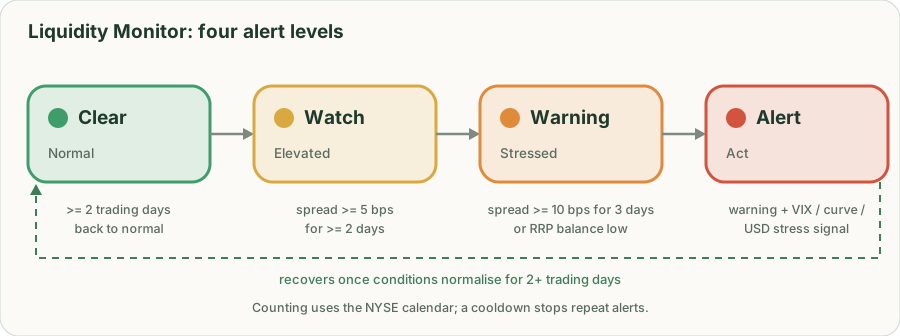
| Level | Roughly means |
|---|---|
| 🟢 Clear | Conditions normalised for at least 2 trading days |
| 🟡 Watch | Spread elevated for at least 2 trading days |
| 🟠 Warning | Spread persistently high, or RRP balances running low |
| 🔴 Alert | Warning conditions plus a market-wide stress signal such as VIX or a deeply inverted curve |
Each level maps to a suggested action, from “resume building positions gradually” through “hold more cash, pause leverage” to “de-risk and hedge”.
Engineering details I cared about
- Trading-day aware. “Two consecutive days” is counted on the NYSE calendar, so weekends and holidays don’t reset or inflate streaks.
- Polite polling. Every 15 minutes during US market hours, hourly otherwise.
- State survives restarts, and a cooldown stops the same alert from firing repeatedly.
- Notifications via Telegram, email (SMTP) or Slack, all configured through environment variables.
- Resilient. Automatic retries and graceful degradation when a data source hiccups.
- Shippable. A pytest suite, a Dockerfile, a systemd example and rotating logs.
Takeaways
The interesting part wasn’t fetching data, it was deciding when to stay quiet. Persistence rules, cooldowns and a small state machine turned a stream of numbers into something I actually trust to interrupt me.
This is a personal monitoring tool, not investment advice.